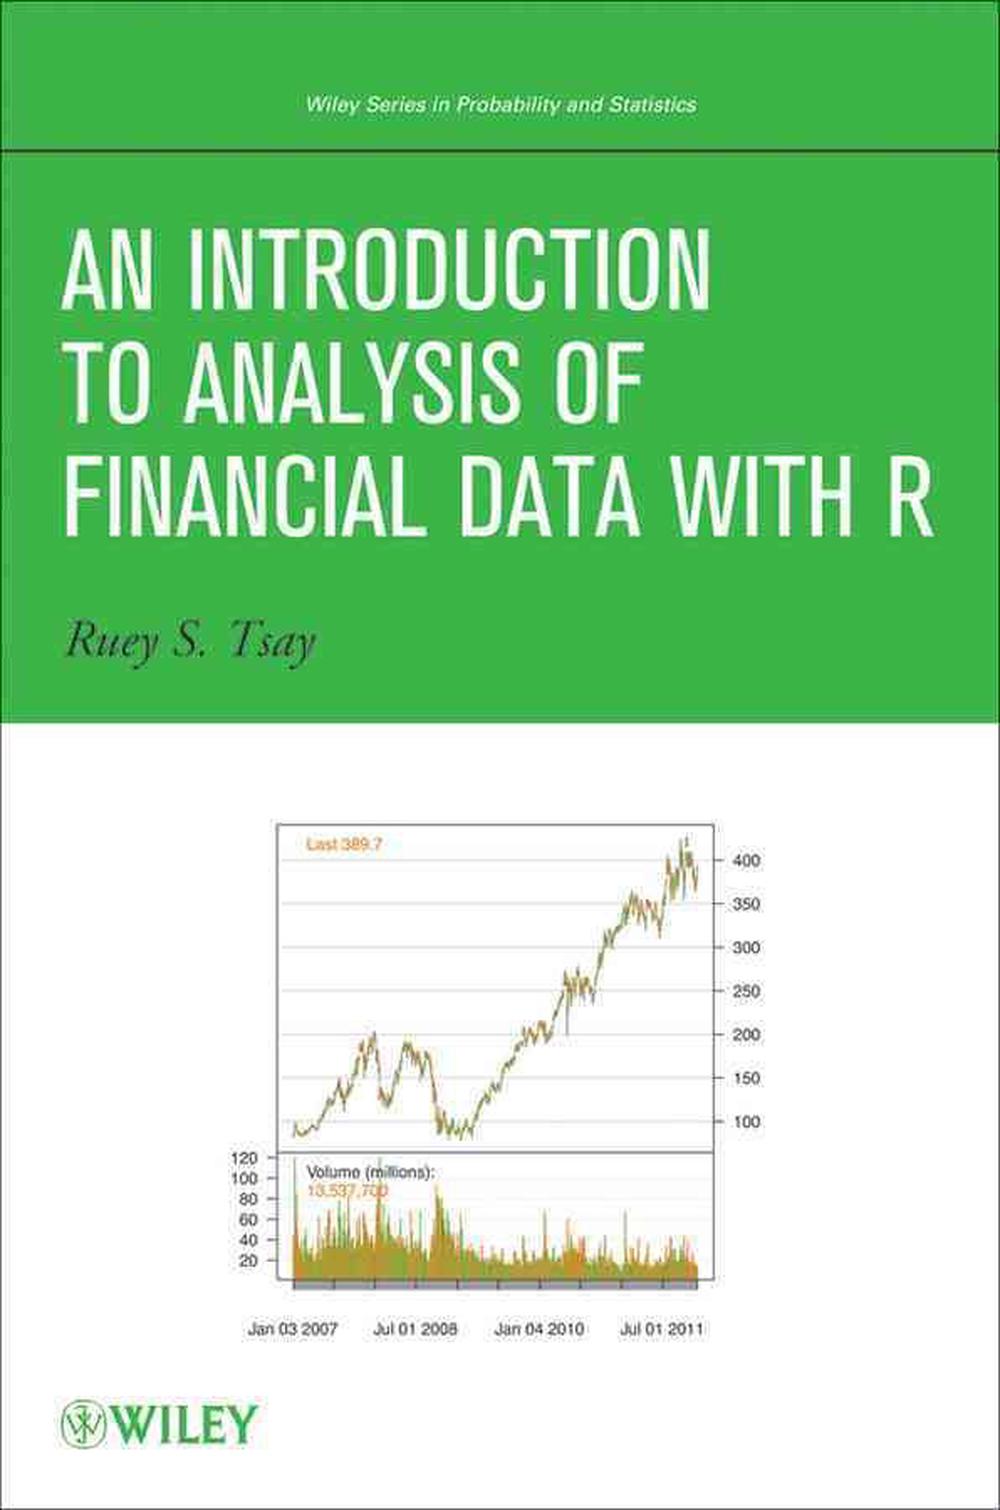
An Introduction to Analysis of Financial Data with R, 1st Edition by Ruey S. Tsay, Hardcover, 9780470890813 | Buy online at The Nile
Departments
 Free Returns*

An Introduction to Analysis of Financial Data with R, 1st Edition

Author: Ruey S. Tsay   Series: Wiley Series in Probability and Statistics

Hardcover
ISBN / EAN: 9780470890813
This textbook is prescribed for the following courses:
Use our Textbook Finder to find the rest of your Textbooks!
$262.79
Or pay later with
Check delivery options
Hardcover

PRODUCT INFORMATION

Summary

A complete set of statistical tools for beginning financial analysts from a leading authority Written by one of the leading experts on the topic, An Introduction to Analysis of Financial Data with R explores basic concepts of visualization of financial data.

Read more

Description

A complete set of statistical tools for beginning financial analysts from a leading authority

Written by one of the leading experts on the topic, An Introduction to Analysis of Financial Data with R explores basic concepts of visualization of financial data. Through a fundamental balance between theory and applications, the book supplies readers with an accessible approach to financial econometric models and their applications to real-world empirical research.

The author supplies a hands-on introduction to the analysis of financial data using the freely available R software package and case studies to illustrate actual implementations of the discussed methods. The book begins with the basics of financial data, discussing their summary statistics and related visualization methods. Subsequent chapters explore basic time series analysis and simple econometric models for business, finance, and economics as well as related topics including:

  • Linear time series analysis, with coverage of exponential smoothing for forecasting and methods for model comparison
  • Different approaches to calculating asset volatility and various volatility models
  • High-frequency financial data and simple models for price changes, trading intensity, and realized volatility
  • Quantitative methods for risk management, including value at risk and conditional value at risk
  • Econometric and statistical methods for risk assessment based on extreme value theory and quantile regression

Throughout the book, the visual nature of the topic is showcased through graphical representations in R, and two detailed case studies demonstrate the relevance of statistics in finance. A related website features additional data sets and R scripts so readers can create their own simulations and test their comprehension of the presented techniques.

An Introduction to Analysis of Financial Data with R is an excellent book for introductory courses on time series and business statistics at the upper-undergraduate and graduate level. The book is also an excellent resource for researchers and practitioners in the fields of business, finance, and economics who would like to enhance their understanding of financial data and today's financial markets.

Read more

Critic Reviews

“"I found this book highly informative and interesting to read. The proper mix of theory and hands-on programming examples makes it recommended reading for both R programmers interested in finance and financial analysts with a basic programming background. Well written and following a clear and defined logical layout, the author has written a current reference text on using a powerful open-source programming language for typical financial analysis." ( Computing Reviews , 25 March 2014) "All in all, this book is a good and useful introduction to financial time series with many real-world examples. It is suitable for use both as a textbook and for self-study, with exercises provided at the end of each chapter." ( International Statistical Review , 14 June 2013)”

“I found this book highly informative and interesting to read. The proper mix of theory and hands-on programming examples makes it recommended reading for both R programmers interested in finance and financial analysts with a basic programming background. Well written and following a clear and defined logical layout, the author has written a current reference text on using a powerful open-source programming language for typical financial analysis.”  (Computing Reviews, 25 March 2014)

“All in all, this book is a good and useful introduction to financial time series with many real-world examples. It is suitable for use both as a textbook and for self-study, with exercises provided at the end of each chapter.”  (International Statistical Review, 14 June 2013)

Read more

About the Author

RUEY S. TSAY, PhD, is H.G.B. Alexander Professor of Econometrics and Statistics at The University of Chicago Booth School of Business. Dr. Tsay has written over 100 published articles in the areas of business and economic forecasting, data analysis, risk management, and process control. A Fellow of the American Statistical Association, the Institute of Mathematical Statistics, and Academia Sinica, Dr. Tsay is author of Analysis of Financial Time Series, Third Edition and coauthor of A Course in Time Series Analysis.

Read more

Back Cover

A complete set of statistical tools for beginning financial analysts from a leading authority Written by one of the leading experts on the topic, An Introduction to Analysis of Financial Data with R explores basic concepts of visualization of financial data. Through a fundamental balance between theory and applications, the book supplies readers with an accessible approach to financial econometric models and their applications to real-world empirical research. The author supplies a hands-on introduction to the analysis of financial data using the freely available R software package and case studies to illustrate actual implementations of the discussed methods. The book begins with the basics of financial data, discussing their summary statistics and related visualization methods. Subsequent chapters explore basic time series analysis and simple econometric models for business, finance, and economics as well as related topics including: Linear time series analysis, with coverage of exponential smoothing for forecasting and methods for model comparison Different approaches to calculating asset volatility and various volatility models High-frequency financial data and simple models for price changes, trading intensity, and realized volatility Quantitative methods for risk management, including value at risk and conditional value at risk Econometric and statistical methods for risk assessment based on extreme value theory and quantile regression Throughout the book, the visual nature of the topic is showcased through graphical representations in R, and two detailed case studies demonstrate the relevance of statistics in finance. A related website features additional data sets and R scripts so readers can create their own simulations and test their comprehension of the presented techniques. An Introduction to Analysis of Financial Data with R is an excellent book for introductory courses on time series and business statistics at the upper-undergraduate and graduate level. The book is also an excellent resource for researchers and practitioners in the fields of business, finance, and economics who would like to enhance their understanding of financial data and today's financial markets.

Read more

More on this Book

A complete set of statistical tools for beginning financial analysts from a leading authority Written by one of the leading experts on the topic, An Introduction to Analysis of Financial Data with R explores basic concepts of visualization of financial data. Through a fundamental balance between theory and applications, the book supplies readers with an accessible approach to financial econometric models and their applications to real-world empirical research. The author supplies a hands-on introduction to the analysis of financial data using the freely available R software package and case studies to illustrate actual implementations of the discussed methods. The book begins with the basics of financial data, discussing their summary statistics and related visualization methods. Subsequent chapters explore basic time series analysis and simple econometric models for business, finance, and economics as well as related topics including: Linear time series analysis, with coverage of exponential smoothing for forecasting and methods for model comparison Different approaches to calculating asset volatility and various volatility models High-frequency financial data and simple models for price changes, trading intensity, and realized volatility Quantitative methods for risk management, including value at risk and conditional value at risk Econometric and statistical methods for risk assessment based on extreme value theory and quantile regression Throughout the book, the visual nature of the topic is showcased through graphical representations in R, and two detailed case studies demonstrate the relevance of statistics in finance. A related website features additional data sets and R scripts so readers can create their own simulations and test their comprehension of the presented techniques. An Introduction to Analysis of Financial Data with R is an excellent book for introductory courses on time series and business statistics at the upper-undergraduate and graduate level. The book is also an excellent resource for researchers and practitioners in the fields of business, finance, and economics who would like to enhance their understanding of financial data and todays financial markets.

Read more

Product Details

Publisher
John Wiley & Sons Inc
Published
7th December 2012
Edition
1st
Pages
416
ISBN
9780470890813

Returns

This item is eligible for free returns within 30 days of delivery. See our returns policy for further details.

$262.79
Or pay later with
Check delivery options
ISBN / EAN: 9780470890813
This textbook is prescribed for the following courses:
Use our Textbook Finder to find the rest of your Textbooks!