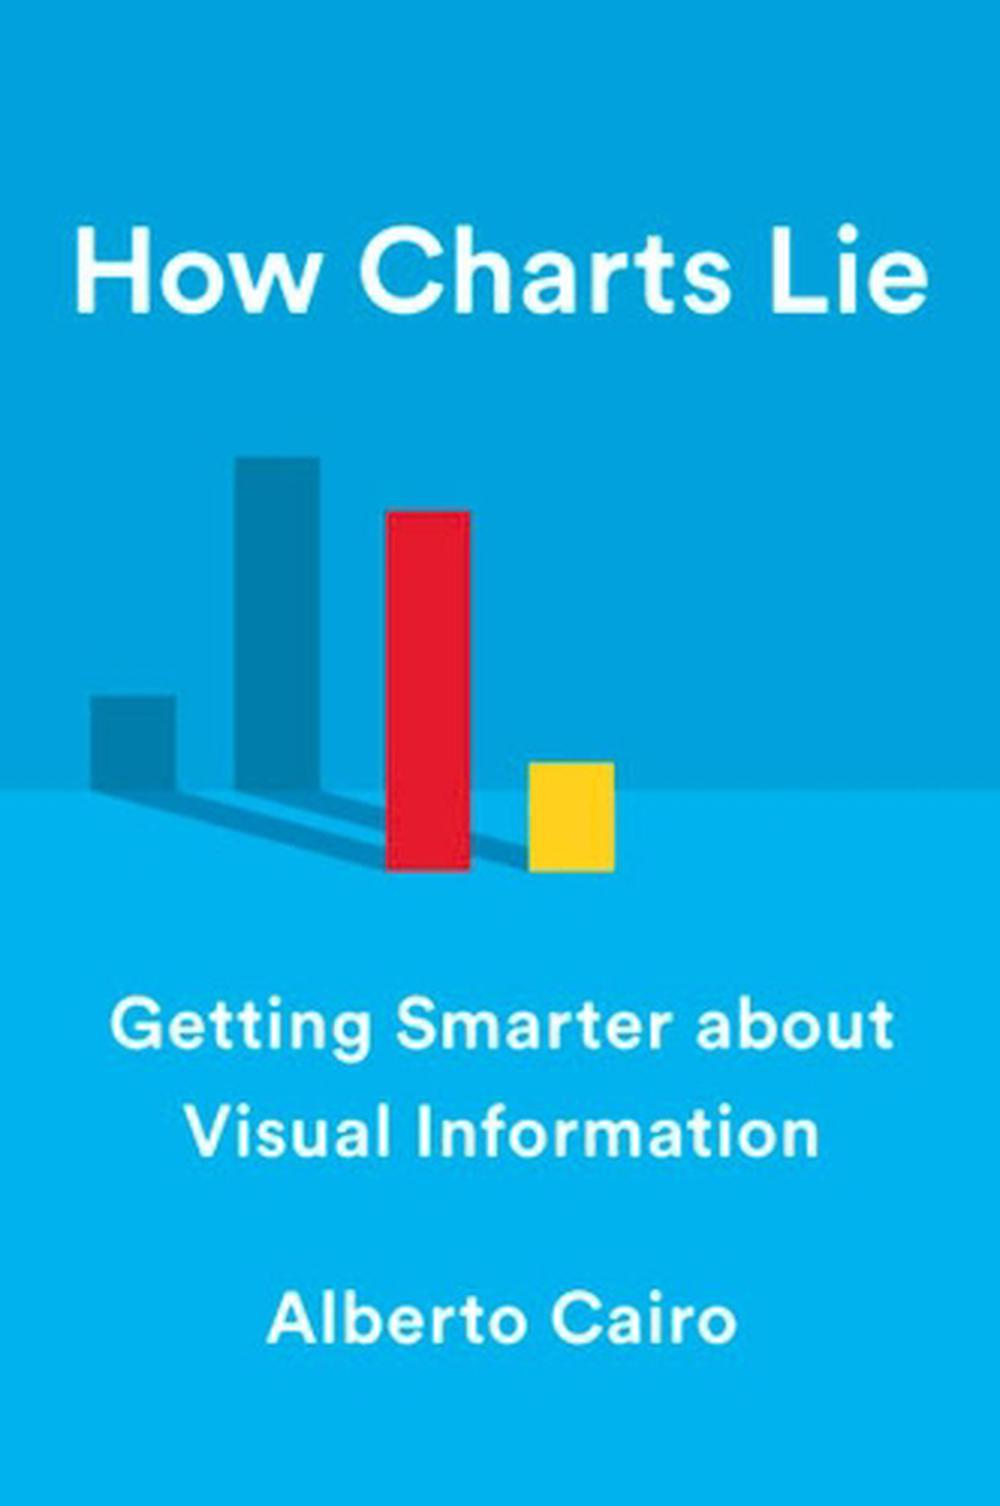
How Charts Lie
getting smarter about visual information
$37.59
- Hardcover
256 pages
- Release Date
14 November 2019
Summary
Unmasking Deception: How to Read Between the Lines of Charts
Today, public conversations are increasingly driven by numbers. Although charts, infographics, and diagrams can make us smarter, they can also deceive—intentionally or unintentionally. To be informed citizens, we must all be able to decode and use the visual information that politicians, journalists, and even our employers present to us each day.
How Charts Lie examines contemporary examples ranging from e…
Book Details
| ISBN-13: | 9781324001560 |
|---|---|
| ISBN-10: | 1324001569 |
| Author: | Alberto Cairo |
| Publisher: | WW Norton & Co |
| Imprint: | WW Norton & Co |
| Format: | Hardcover |
| Number of Pages: | 256 |
| Release Date: | 14 November 2019 |
| Weight: | 500g |
| Dimensions: | 244mm x 163mm x 25mm |
You Can Find This Book In
What They're Saying
Critics Review
”[Alberto Cairo’s] book reminds readers not to infer too much from a chart, especially when it shows them what they already wanted to see. Mr Cairo has sent a copy to the White House.” – The Economist
About The Author
Alberto Cairo
Alberto Cairo is the Knight Chair in Visual Journalism at the School of Communication of the University of Miami. The author of several textbooks, he consults with companies and institutions like Google and the Congressional Budget Office on visualizations. He lives in Miami, Florida.
Returns
This item is eligible for free returns within 30 days of delivery. See our returns policy for further details.


